
THE FULL STORY BEHIND CQC’s OUTSTANDING CARE HOMES

- Less than 1% of care homes in England have been given an Outstanding rating by the CQC
- 75% of the 115 Outstanding care homes are, in fact, Outstanding in only 2 out of the 5 questions and "only" Good in the other 3.
-
Only 1 home is totally Outstanding across all 5 questions
-
The South East and South West regions have nearly half of all Outstanding care homes, against a 33% share of all care homes in England
-
Only 38% of local authorities can boast an Outstanding home within their area.
-
Warwickshire has nearly 9 times as many Outstanding homes across all its homes than the national average
-
There are 9 care groups who account for 22.5% of all Outstanding Ratings – but only account for 0.4% of all care homes.
John Kennedy, an independent consultant and commentator in adult social care, recently wrote an insightful editorial in the Guardian that asked What makes a care home outstanding? where he identified the 3 key attributes of an Outstanding Care Home.
John also gave examples of where some larger care groups could boast not only an Outstanding home, but also homes in the other lesser ratings of Good, Requires Improvement, and even the dreaded Inadequate.
He also gave an example where one home moved from Outstanding to Inadequate in just a few months. Whilst the home had a change of registered manager between the two inspections, one must not only question what went wrong at the home, but also look at the way the home was initially rated.
I have looked at the Outstanding situation for care homes from a couple of different angles; firstly, by looking at the care homes that are currently Outstanding and how they rated in each of the 5 questions: Safe, Effective, Well Run, Caring and Responsive, and I also looked at the geographical breakdown of those homes.
ONLY ONE CARE HOME (OUT OF 115) IS 100% OUTSTANDING
Take a bow Peregrine House, in Whitby, North Yorkshire and their provider Aikmo Medical Limited, as you alone received an Outstanding for all 5 questions.
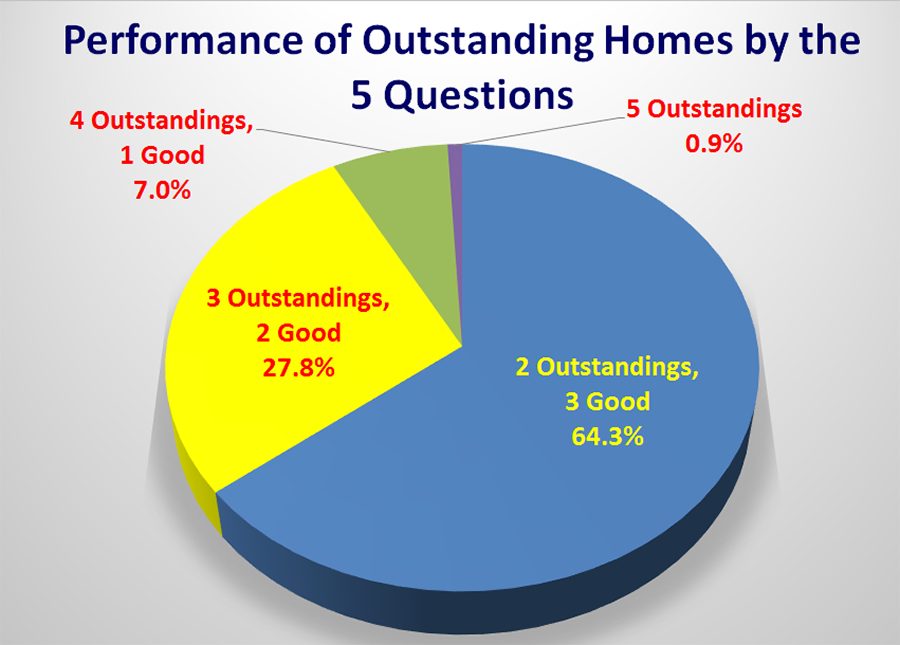
Of the remaining 114 outstanding homes, 8 were Outstanding in 4 out of 5 questions, 32 Outstanding in 3 out of 5. Incredibly 74 homes got their Outstanding rating despite being Outstanding in only 2 out of the 5 questions, when they should possibly have only been given a Good rating? (N.B. if we move down one rating, homes that get 2 Good ratings and 3 Requires Improvements, are more often relegated to Requires improvement)
108 of the 115 homes only got a Good for Safe (this is very much the question that brings most homes’ ratings down, but that is a different story that I will shortly publish)
On their website, the CQC quantifies Safe as “you are protected from abuse and avoidable harm.”, so despite still getting a Good, this was a major failing point for a truly Outstanding home, in what I would have thought safety is probably the top priority for people placing their loved ones in care.
In May 2015, when the new CQC standards and ratings were still being embedded within the sector, I reported some massive geographical variances in the share of the various ratings, citing one local authority as being 10 times more likely to have an Inadequate care home than in another. More recently I have updated the regional analysis and still found variances.
So I have taken another look at the geographical pattern for Outstanding ratings in care homes.
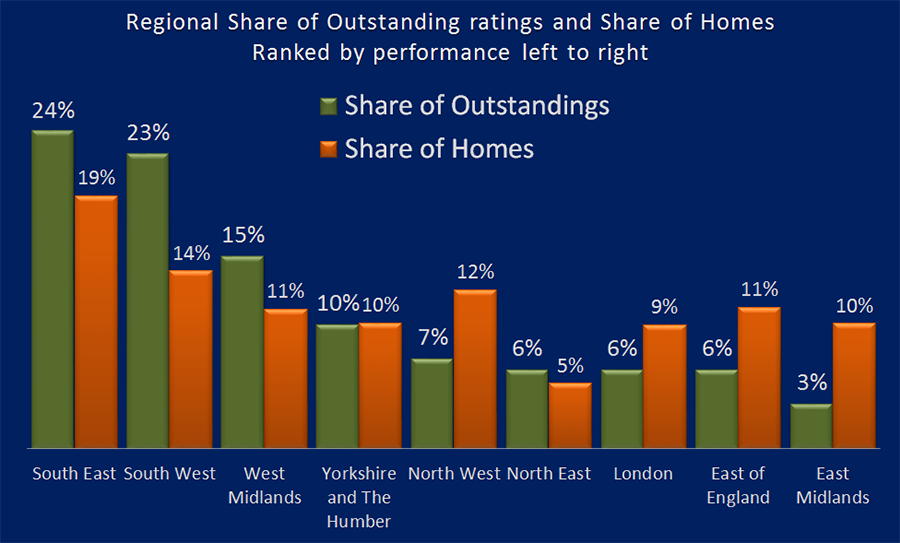
On a regional basis, the South West and the South East account for around a third of care homes in England, but can boast just under half of all Outstanding homes (against a third of a care homes). At the lower end of the scale, East Midlands has 3% of all Outstanding homes, against 10% of all homes.
In the North East, their share of Outstanding homes is higher than their share of total homes. However, it would look much worse without Helen McArdle Care. They have 17 care homes, 4 of which area Outstanding, and make up more than half the Outstanding homes in the region.
Looking at individual local authorities, only 38% out of the 152 any Outstanding homes in their area, which must be a call to action for the 100 authorities who cannot claim such a distinction.
Again, there is a big variance in the number of Outstanding homes in comparison to a Local Authority’s portfolio of homes. Warwickshire heads the table with 7% of all Outstanding homes, whilst it only had 1.1% of all care homes in England. At 7% it is nearly 9 times higher than the national average.
However, Warwickshire is the base for WCS Care. They have 12 care homes, 5 of which are rated Outstanding – and make up all but 2 of the county's Outstanding homes.
The same applies to The Cocklebury Farmhouse Homes Limited, in Wiltshire, who make up 3 of the 5 Outstanding homes in the county.
In fact accolades should be given to 9 care groups, who have achieved 23.5% of all Care Home Outstanding ratings, and yet only account for 0.4% (or 1 in every 250) of all care homes.
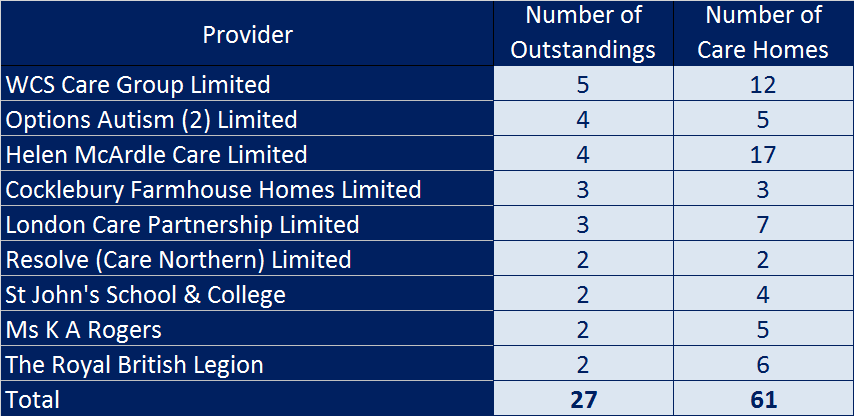
(Congratulations must also be passed on to Voyage 1 with 3 Outstandings, however from a much larger home base.)
A CQC rating is a massive commercial benefit or financial burden, and so it is only right that a fair hand is placed upon all rating decisions, and the figures above must bring into question whether the CQC is doing so on a local or regional basis. Either that or there is in fact a massive variation in the quality of care being delivered, – at least when the 5 challenges the CQC is setting each home are taken into consideration, and the Outstanding mantel is concerned.
The data from this report was taken from the CQC latest ratings download on 4th October 2016, so some ratings will obviously have changed since that date, as will ratings for first inspections for those homes not yet rated.